Back to Home
 Back to Home
Dashboards
Live Operations Command Dashboard
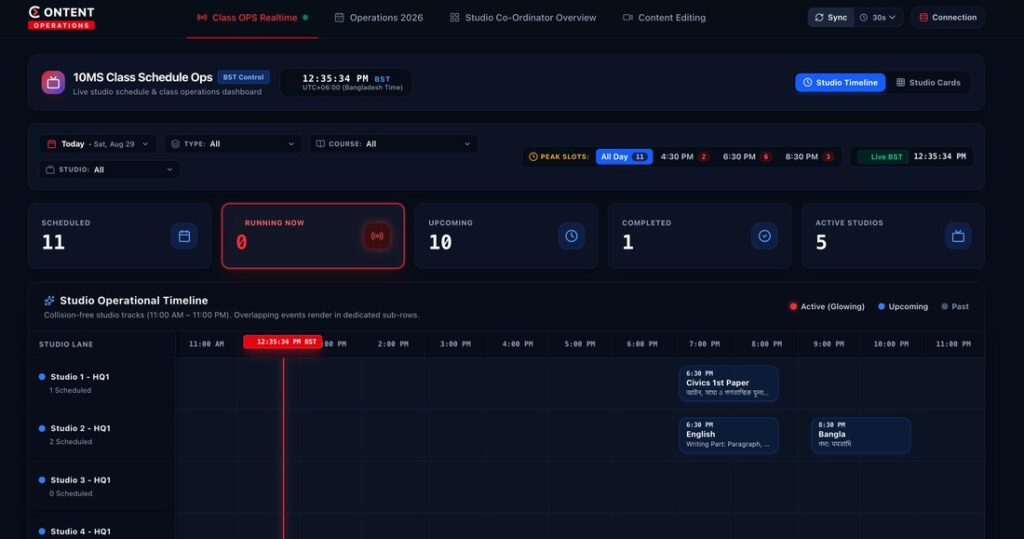
Running live classes across hundreds of batches meant the operations team was juggling spreadsheets, chat threads and manual reports. I designed a single command dashboard that pulls attendance, instructor status and open issues into one live view.
The problem
Issues were found late and tracked in too many places. Managers could not tell, at a glance, which classes were at risk.
What I built
- A live timeline of every class with colour-coded status
- Escalation counters that surface unresolved issues first
- Daily and weekly trend views for attendance and incident rates
Result
Response time to class issues dropped sharply and the daily reporting routine went from hours to minutes.